Agility Reports KD 926.9 Million Net Profit for the Third Quarter 2021
| Q3 2021 (Million KD) | Q3 2020 (Million KD) | Variance (%) | 9 months 2021 (Million KD) | 9 months 2020 (Million KD) | Variance (%) | |
| Revenue | 124.5 | 97.5 | 27.7% | 344.7 | 292.4 | 17.9% |
| Net Revenue | 65.8 | 50.6 | 30.2% | 185.8 | 161.4 | 15.1% |
| EBIT | 19.6 | 18.4 | 6.6% | 59.7 | 47.1 | 26.7% |
| Net Profit | 926.9 | 15.3 | 5952.4% | 978.1 | 31.5 | 3002.7% |
| EPS (fils) | 440.34 | 7.27 | 5957.0% | 464.67 | 14.97 | 3004.0% |
KUWAIT – November 14, 2021 – Agility, a leader in supply chain services, innovation and investment, today reported third quarter 2021 earnings of 440.34 fils per share on net profit of KD 926.9 million, an increase of 5,952.4% over the same period in 2020. EBIT increased 6.6% to KD 19.6 million, and revenue grew 27.7% to KD 124.5 million. Adjusted for revaluation impact of investments measured at fair value through profit and loss, net profits from continuing operations increased 17.1% to KD 12.7 million from same period in 2020.
For the first nine months of 2021, earnings were 464.67 fils per share on net profit of KD 978.1 million, an increase of 3,002.7% over the same period in 2020. EBIT increased 26.7% to KD 59.7 million, and revenue grew 17.9% to KD 344.7 million. Adjusted for the revaluation impact of investments measured at fair value through profit and loss, net profits from continuing operations for the nine months stood at KD 35.9 million an increase of 45.3%.
Agility’s profit from DSV deal
For Q3, Agility reported an exceptional gain stemming from the sale of its Global Integrated Logistics unit to DSV in exchange for shares in DSV. The profit from discontinued operations that GIL reported in Q3 was KD 918.4 million and for the nine months was KD 952.8 million.
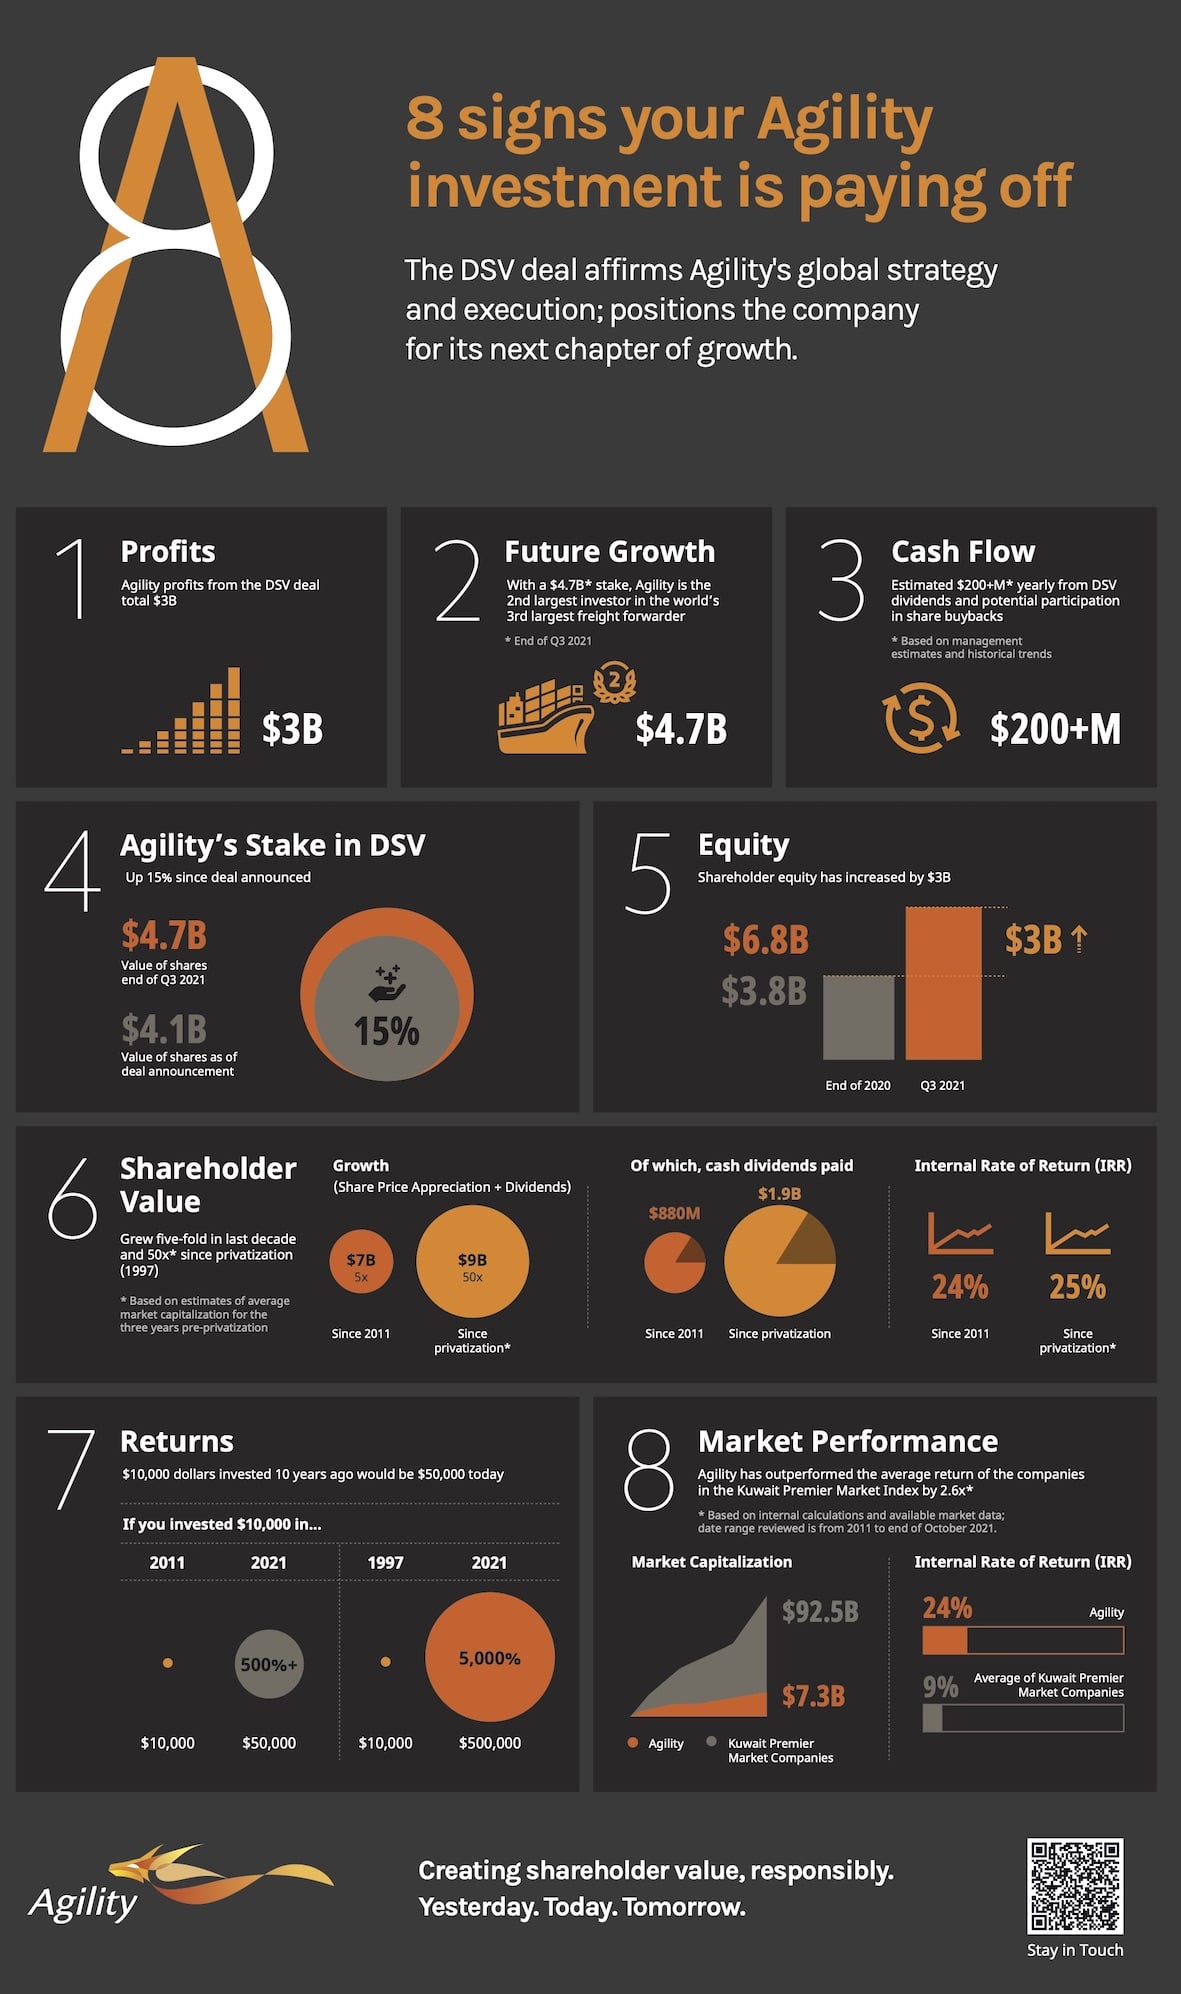
“Agility has consistently created shareholder value, which has grown fifty-fold[i] with an internal rate of return of 25% since privatization in 1997. Over the past decade, we were able to grow shareholder value five-fold[ii] and generated a 24% internal rate of return (IRR), outperforming the average return of companies on the Kuwait Premier Market Index by 2.6 times[iii],” said Tarek Sultan, Agility Vice Chairman and CEO.
“We believe our best days lie ahead though,” Sultan said. “We still own and operate the businesses that have historically generated 80% of Agility profits. Our stake in DSV has already appreciated 15% since the sale was announced in April, and we expect a return of an estimated $200m a year in cash through dividends and participation in DSV’s share buy-back program[iv]. Looking to the future, we are investing in high-growth markets, industries, and technologies.”
Agility’s Stake in DSV
In August, Agility finalized the sale of GIL to DSV in exchange for an 8% stake in DSV (19.3 million shares of DSV common stock). The deal makes Agility the second-largest shareholder in DSV, which is the world’s third-largest freight forwarding company.
“In building GIL, we demonstrated that we had a unique vision and the ability to turn that vision into a successful, global business that created value for our shareholders. DSV’s acquisition of GIL is an affirmation of Agility’s ability to build, nurture and monetize businesses at a global scale,” Sultan said. “The sale of GIL to DSV has already generated returns for Agility shareholders. From a strategic standpoint, it allows Agility to maintain global reach and market access to an attractive and growing supply chain industry,” Sultan said.
Agility’s stake in DSV will be reported, as per IFRS 9, as financial asset at fair value through other comprehensive income, and will replace GIL’s equity value on the balance sheet. As of the date of closing, the difference between GIL’s equity value and the fair value of Agility’s DSV stake was booked as a one-time, non-cash gain from disposal of discontinued operations.
Agility’s Infrastructure Companies
Agility’s Infrastructure portfolio of companies, the main drivers of the company’s profitability in recent years, continue to perform strongly.
Agility Logistics Parks’ (ALP) performance has been in line with 2020 results. Demand for warehousing space continues to grow. ALP is both optimizing its existing land bank and growing its supply of available land to meet customer demand. Operations in Kuwait, Saudi Arabia and Africa are strong, and ALP is looking for new markets to achieve additional growth.
Tristar, a fully integrated liquid logistics company, posted a 26.5% increase in revenue for Q3. This performance is driven by strong recovery in international oil prices, good performance in the Road and Transport segments, and favorable dry bulk charter rates in the Maritime segment. We expect this strong performance to continue into the fourth quarter.
National Aviation Services (NAS) reported 77.6% growth in Q3 revenue. NAS’s performance reflects a major recovery in aviation and increasing passenger and cargo volumes across NAS’s network. NAS’s development of pandemic-related technology platforms and applications, intended to help aviation and health authorities facilitate safe travel, have been highly profitable. New businesses and the addition of operations at Baghdad and in the DR Congo and South Africa have also been profitable and positive contributors.
United Projects for Aviation Services Company (UPAC) experienced an 11% increase in Q3 revenue compared with the same period in 2020. The increase was primarily the result of higher revenue from airport-related services and parking following a gradual increase in traffic and the phased Q3 opening of operations and facilities at Kuwait International Airport. That said, UPAC revenue continues to be affected by pandemic-related travel restrictions that remain in place and constrain passenger traffic. UPAC continues to take measures to reduce the pandemic’s impact on its business. Amid a successful vaccination campaign in Kuwait, UPAC operations have begun to show steady signs of recovery. UPAC anticipates gradual growth in aviation traffic in Q4 2021 and into 2022.
UPAC reports that construction of Abu Dhabi’s Reem Mall is more than 90% complete. The mall, on Reem Island, will contain 2 million square feet of retail, leisure, dining, and entertainment choices. It will feature the region’s first fully integrated omni-channel retail ecosystem with fully enabled digital, e-commerce and logistics capabilities. Reem will be home to the world’s largest snow play park, Snow Abu Dhabi.
At Global Clearance House System (GCS), Agility’s customs digitization company, Q3 revenue grew 48.6%. The increase was driven by higher trade volumes and initiatives implemented by the company to spur growth.
Recap of Agility Q3 2021 Financial Performance
- Agility’s Adjusted Net Profit from continuing operations increased 17.1% to KD 12.7 million from 10.8 million a year earlier.
- Agility’s EBIT increased 6.6% to KD 19.6 million.
- Agility’s Revenue increased 27.7%, to KD 124.5 million and Net Revenue increased by 30.2%.
- Agility enjoys a healthy balance sheet with KD 3 billion in assets including KD 1.4 billion of DSV shares. Net Debt for continued operations stood at KD 305.4 million as of September 30, 2021. Reported operating cash flow was KD 127 million for the third quarter of 2021 an increase of 10.2% from same period last year.
About Agility
Agility is a global supply chain company, and a leader and investor in technology to enhance supply chain efficiency and sustainability. It is a pioneer in emerging markets and one of the largest private owners and developers of warehousing and light industrial parks in the Middle East, Africa and Asia. Agility’s subsidiary companies offer airport services, e-commerce enablement and digital logistics, customs digitization, remote infrastructure services, fuel logistics, and commercial real estate and facilities management.
For more information about Agility, visit Agility.com
Twitter: twitter.com/agility
LinkedIn: linkedin.com/company/agility
YouTube: youtube.com/user/agilitycorp
[i] Based on share price appreciation and dividends
[ii] Based on share price appreciation and dividends
[iii] Based on internal calculations and available market data from the date range 2011 to end of October 2021
[iv] Based on management estimates and historical trends


